The next set of Articles are documenting a presentation I’m working on to demonstrate Continuous Delivery, and how in a world where CD is desired, it’s becoming increasingly important for the appropriate level of testing to happen. I’ll be breaking them down to tackle one topic at a time, finally building up to a full demo on how I feel CD can work.
Firstly, I’m going to start with a problem CI/CD can address – Performance Testing. Not so much on how to performance test or how CI/CD can build systems that don’t require it, but how a continuous delivery pipeline can quickly alert developers to potential problems that could otherwise remain undetected and take ages to debug once in production.
Nothing new or groovy here, but a problem most developers (and definitely sql developers) are familiar with: the N+1 problem. Java developers using Hibernate will be familiar with the @OneToMany annotation, but less so on the @Fetch annotation, and even less so on the implications of changing the FetchMode. I aim to demonstrate how something as simple as changing a Hibernate @OneToMany Fetch strategy can drastically affect the performance of a system
There are several good reasons why you may want to do this:
* This is a reasonable thing to do: Maybe you want to lazy load children, no point eagerly loading all details with a join
* Might not always be a bad thing to do (perhaps most of the time only a few children are accessed, which negates the overall performance impace) but testing should be done to assess the potential impact on performance
Side-bar: The demo project for this article was originally ported from the spring boot data rest example within their samples, however the @Fetch annotation appears to be ignored, which makes it difficult to demonstrate.
This article gives a good direction on what I expected to happen and what the problem likely is: http://www.solidsyntax.be/2013/10/17/fetching-collections-hibernate/
I suspect the spring boot configuration doesn’t use the Criteria API behind the scenes, which means the @Fetch annotation will be ignored.
The application is a simple school class registration system, with the domain modelled around classes and students. One GET resource is available which returns all classes and students as children nodes. Below is a sample of the returned json:
  {
    "id": 3,
    "className": "Oakleaf Grammar School - Class 3",
    "students": [
      {
        "id": 970,
        "firstName": "Marie",
        "lastName": "Robinson"
      },
      {
        "id": 2277,
        "firstName": "Steve",
        "lastName": "Parker"
      },
      {
        "id": 4303,
        "firstName": "Lillian",
        "lastName": "Carpenter"
      },
      {
        "id": 9109,
        "firstName": "Samuel",
        "lastName": "Woods"
      }
    ]
  }
So at this point, I have a simple application whose performance can be altered by simply changing the @Fetch annotation, but how can we test the effect of this?
This is what Gatling is designed for. It is a performance and load testing library written in Scala, which has a really nice DSL that can be used to express scenarios for testing load on systems
This is code required to define a scenario for testing our system:
import io.gatling.core.Predef._
import io.gatling.http.Predef._

class SchoolClassLoadTest extends Simulation {

val httpConf = http
.baseURL("https://ben-foster.dev:8080") // Here is the root for all relative URLs

val scn = scenario("Scenario Name").repeat(10, "n") {

exec(http("request_1") // Using http protocol
.get("/v1/class") // Get http method with the relative url
.check(status.is(200))) // Check response status code is 200 (OK)
  }
}
Not much is it?
Side-bar: Gatling also comes with is a recorder UI. This allows you to record all interactions with applications over HTTP and save them as scenarios. Gatling achieves this by acting as a proxy, which you can use like any other web proxy. You can route web browser or application traffic via the Gatling Recorder Proxy, and it will record all interactions made through it and save them as a scenario similar to the one above, which can then be tweaked later.
Once you have your scenario defined, you can configure your simulations to meet whatever load and duration parameters you like. For example in our app I’m going to run the test simulating 10 concurrent each making 10 requests:
setUp(scn.inject(atOnceUsers(10)).protocols(httpConf))
This is just a simple example of what you can do with Gatling: you can specify ramp up and down of users to test how an app scales; pause between steps to simulate human interaction; and much more. For more about what you can do with Gatling check out their QuickStart Page
Back to our app. I’m now going to hit this simulation against our app whilst it’s using the FetchMode.JOIN config:
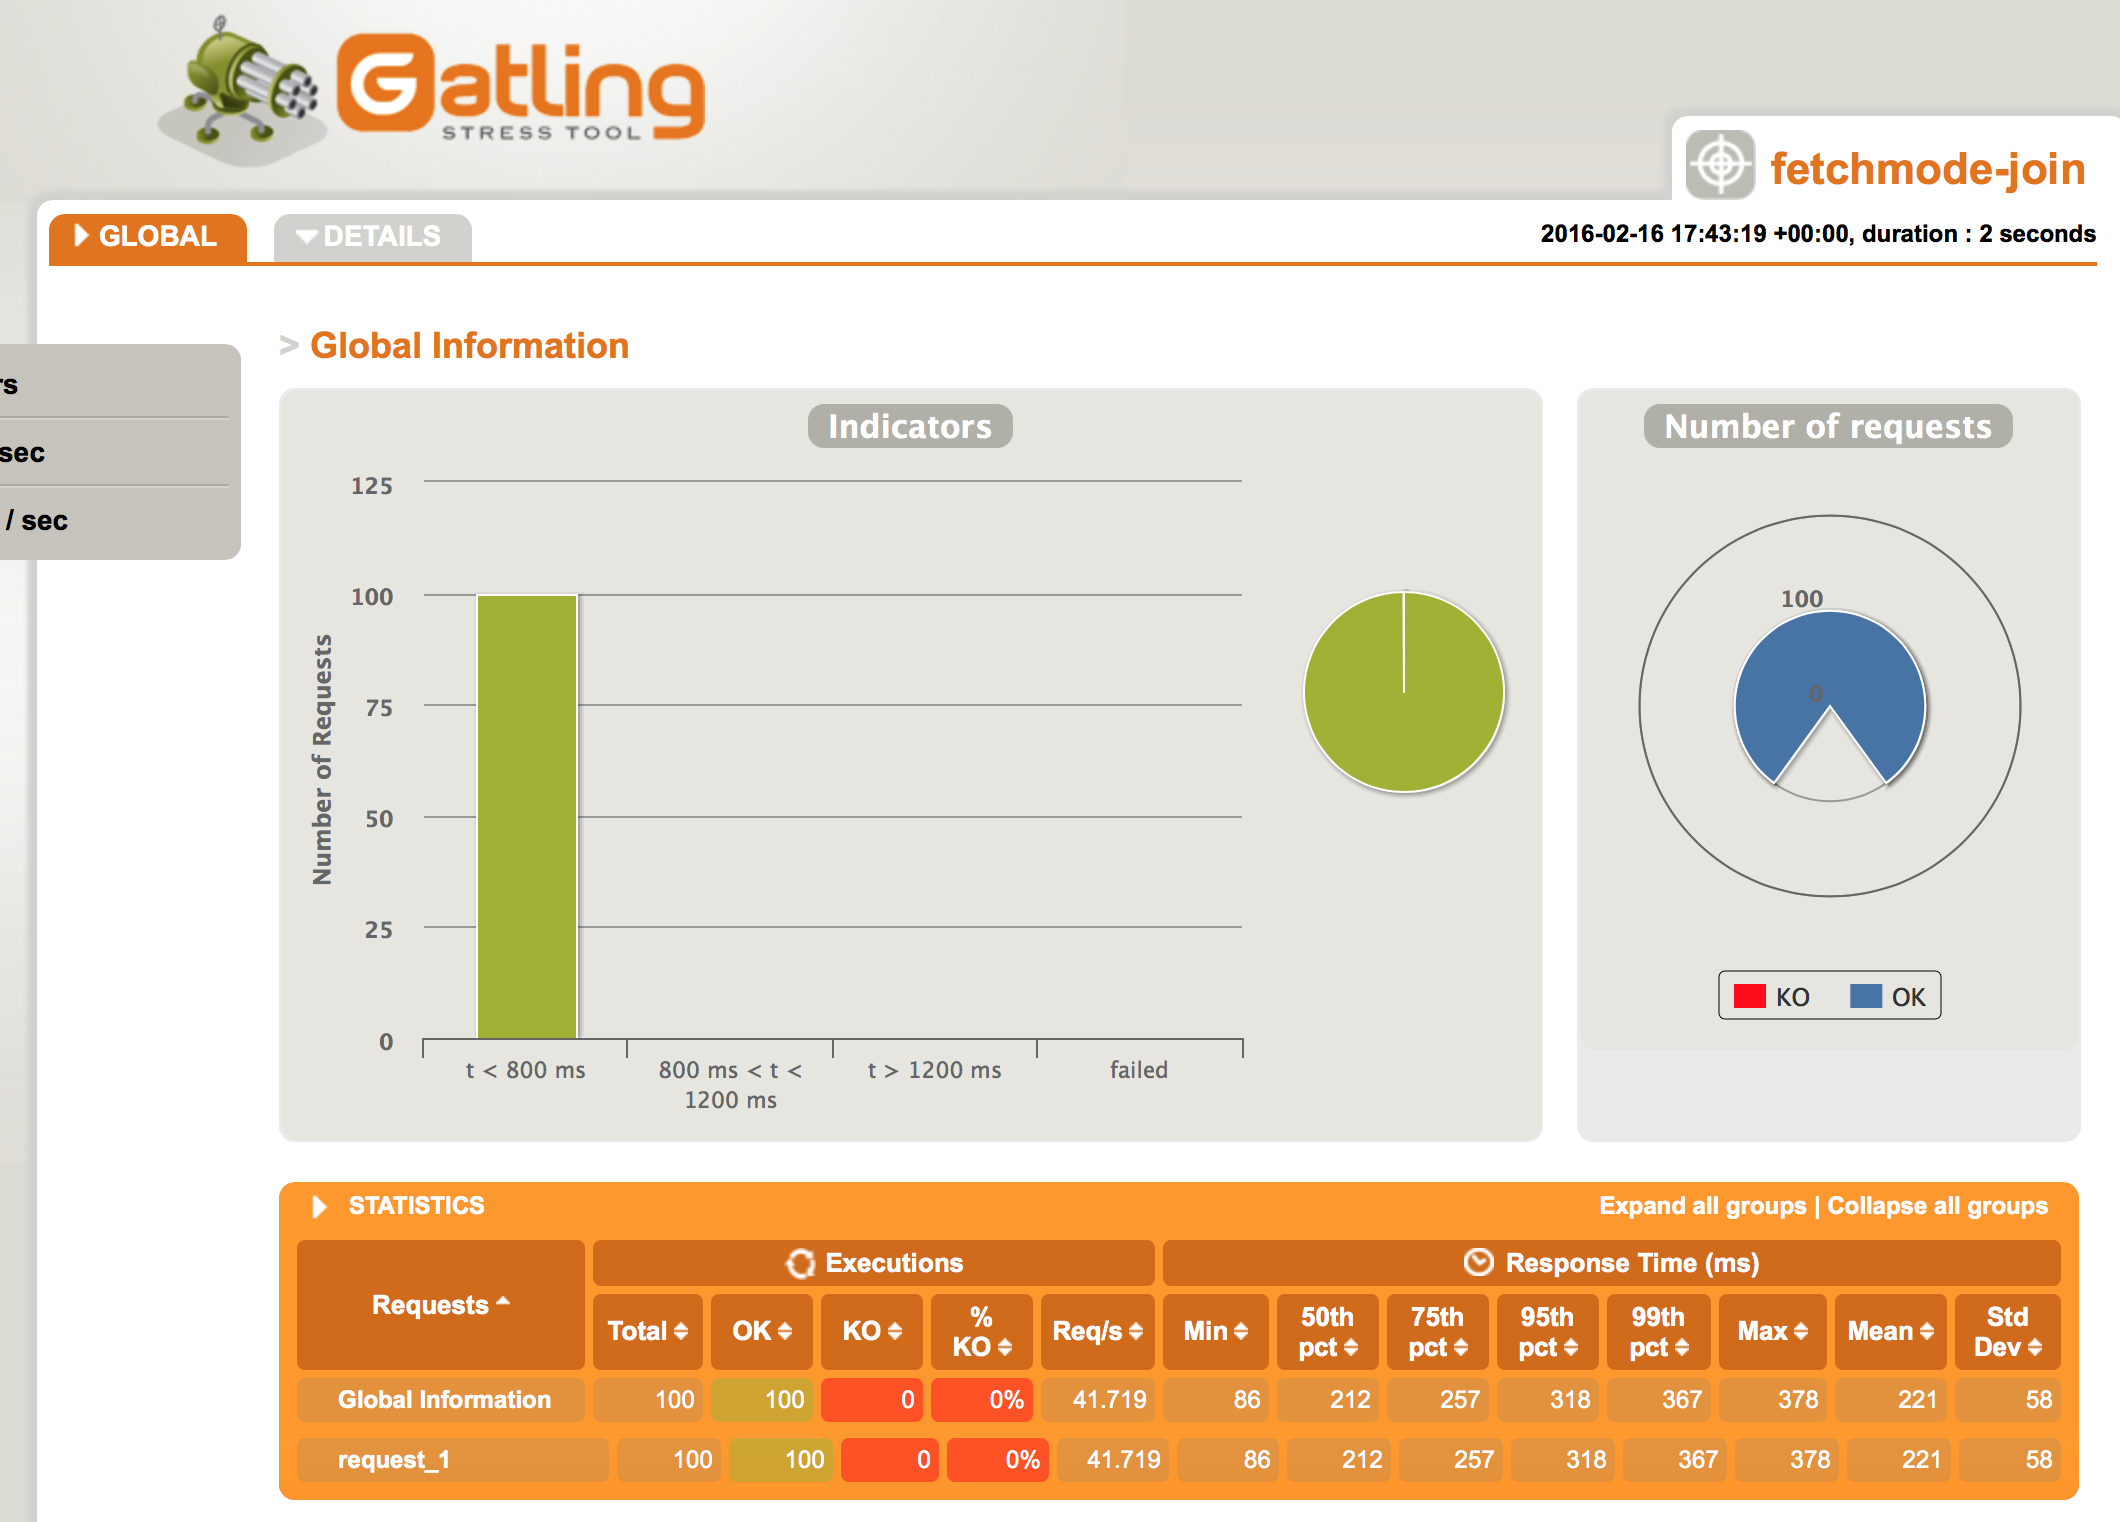
N.B. I’ve warmed up the DB cache before running both the before and after benchmarks by running the simulation once before I’ve recorded the results.
Above is the baseline for our app – you can see the mean response time is 221ms, and the max is 378ms. The 95 percentile is 318ms. Now look what happens when I simply change the @Fetch strategy from JOIN to SELECT:
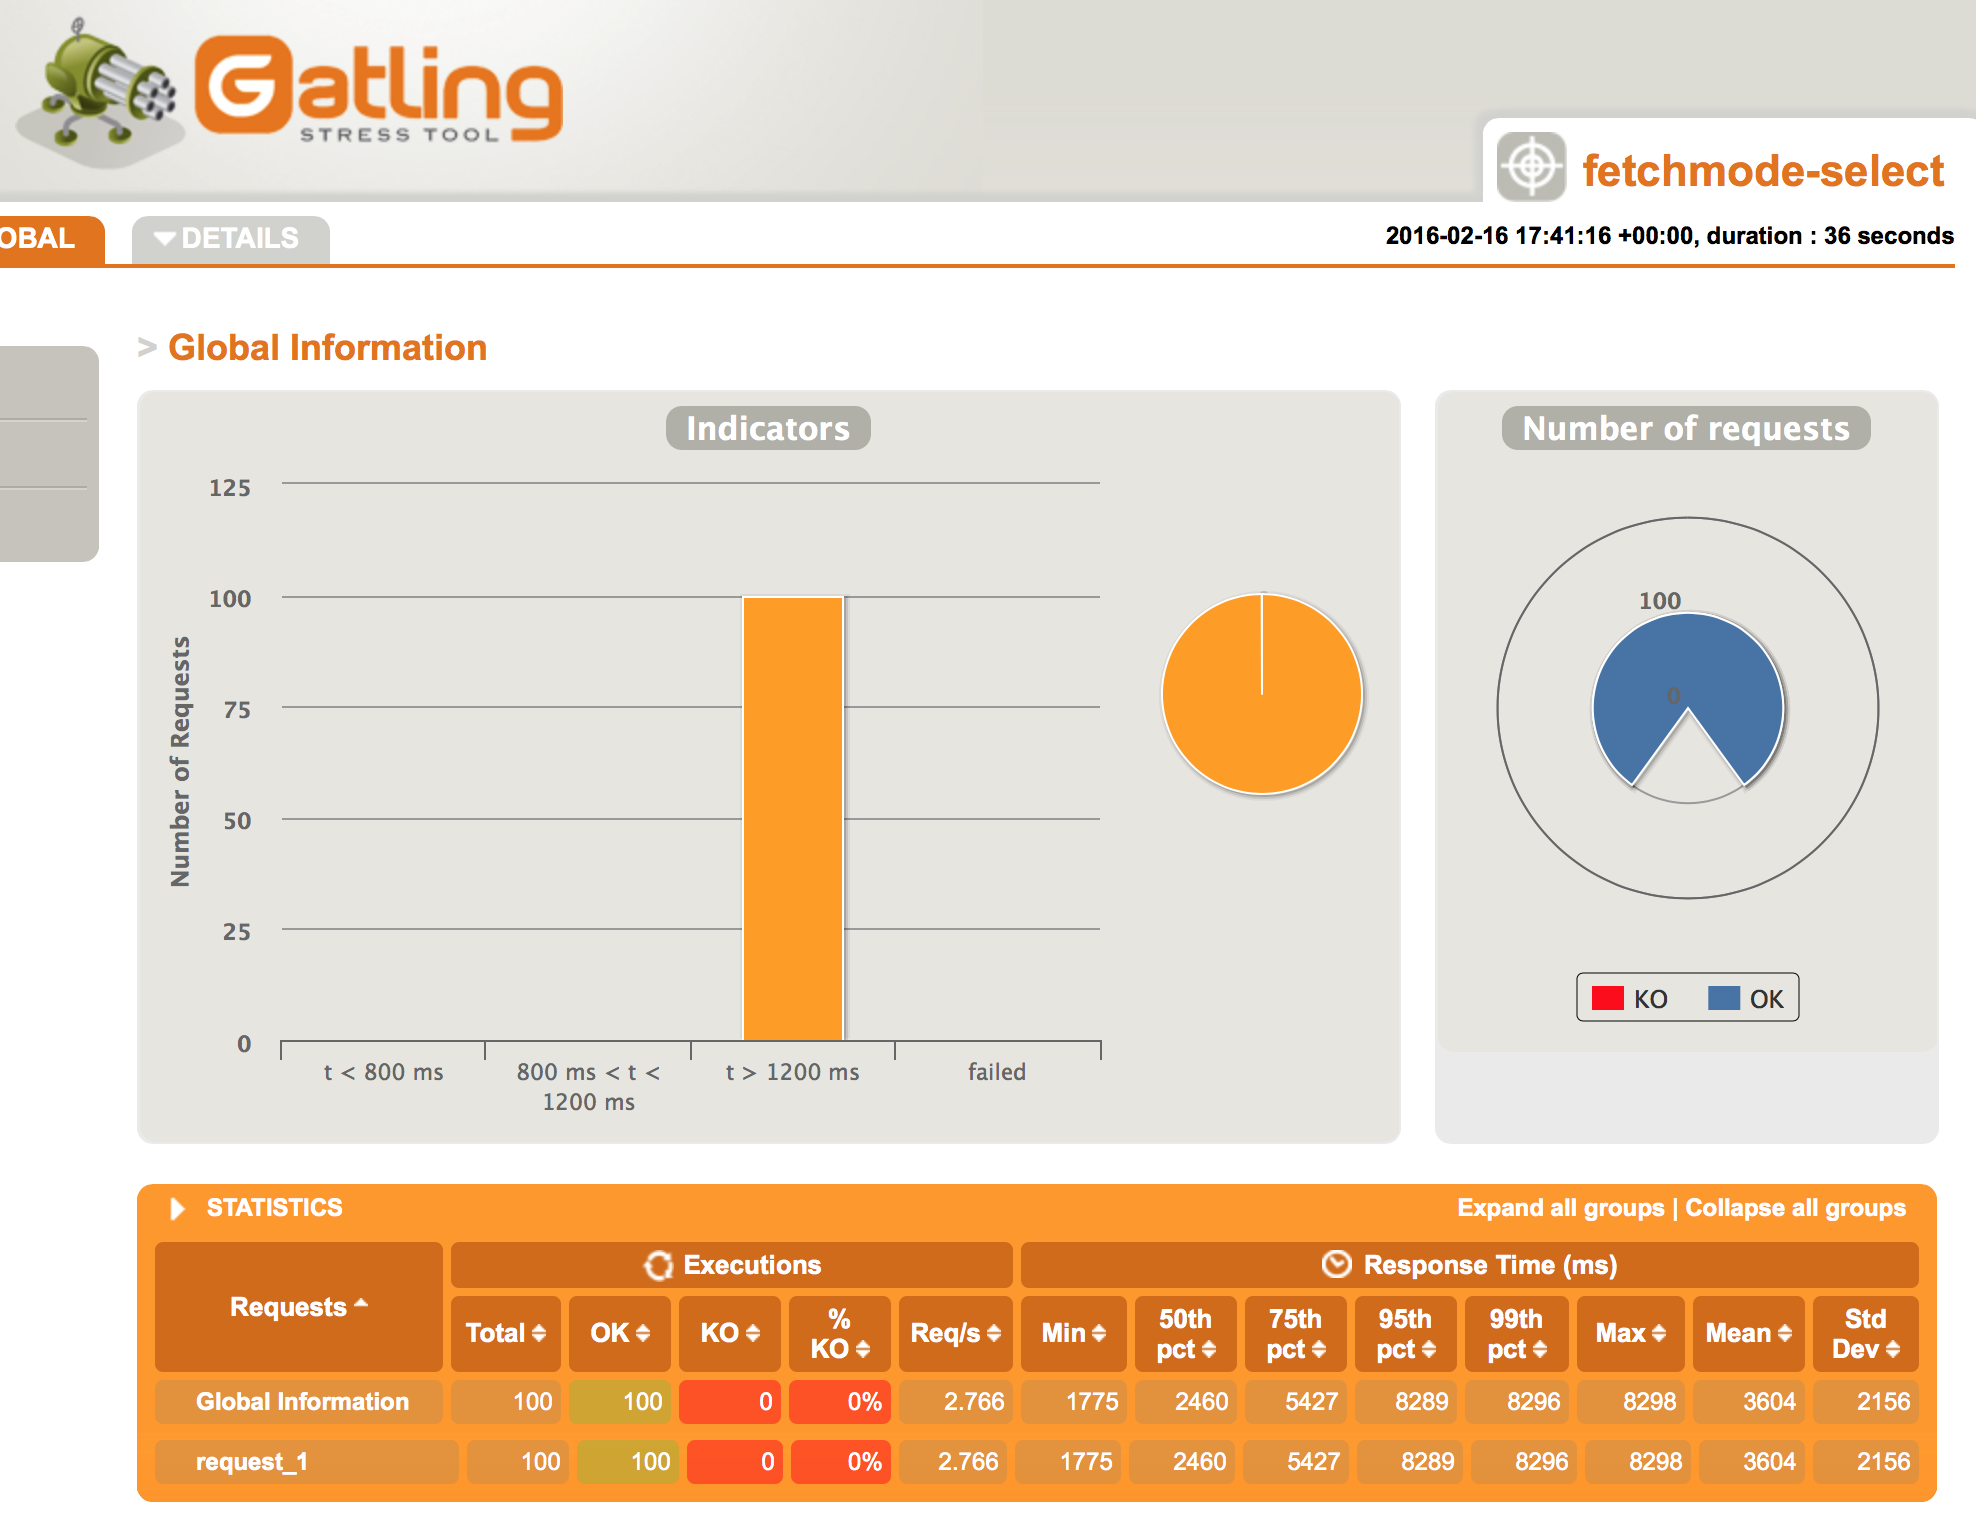
The average response time has increased from 221ms to 3.4 seconds, with the 95th percentage rocketing up to 8.3 seconds! Something as simple as an annoatation change can have such a dramatic impact on performance. The worrying thing is this is so easy to do: it could be done by someone unfamiliar with Hibernate and database performance tuning; by someone frantically looking to find some performance gain and changing a number of things arbitrarily; or what I consider worse – someone who believes that the benefits of doing this outweigh the performance knock, but fail to gather the evidence to back it up!
Now that we’ve got the tools required to test performance, in my next article I’ll look into how this can be proactively monitored between releases, stay tuned…