Over the past few days I have been looking into monitoring Scala and Akka applications, as a number of new integration projects at work are using this framework. Scakka is designed to allow easy building of concurrent applications, and is a great middle-ground for transitioning from OOP to a functional-based approach.
The choices within this first investigation were between AppDynamics and a combination of Kamon, StatsD, Graphite and Graphana. So what are the two:
AppDynamics (http://www.appdynamics.com): An Application Performance Management tool, capable of providing detailed analytics of a system, not just for the JVM but a variety of technologies, single apps or distributed interactions across a network.
The second choice is actually a combination of open source tools, which provide a subset of AppDynamics’ functionality:
Kamon (http://kamon.io): Modular API for logging metrics for JVM based applications
StatsD (https://github.com/etsy/statsd): Metric collator and aggregator service, which can take metrics from a number of sources (Kamon being one of them)
Graphite (https://github.com/graphite-project/): A highly scalable real-time graphing system
Graphana (http://grafana.org): A dashboard builder and service capable of presenting charts provided by Graphite, Elasticsearch and a number of others in a unified dashboard
Disclaimer: AppDynamics has saved my bacon in the past on a previous project, providing detailed insight to a concurrent system which was suffering from performance issues. Needless to say I’m a little biased to it but still interested to see what else there is out there.
I am aware that there is also New Relic, but given it’s fairly comparable to AppDynamics I dropped it as part of this (mainly because it didn’t provide a broad enough contrast in choice, and it isn’t free)
So I started off with AppDynamics, as that was familiar ground and suspeted it wouldn’t be too much effort given my previous experience with it.
I used the latest version at the time (4.1), and setup the Controller in a VM. This was fairly straightforward as usual (although it takes quite a while) and after this I downloaded a Java Agent and hooked it up to my app using the -javaagent VM argument.
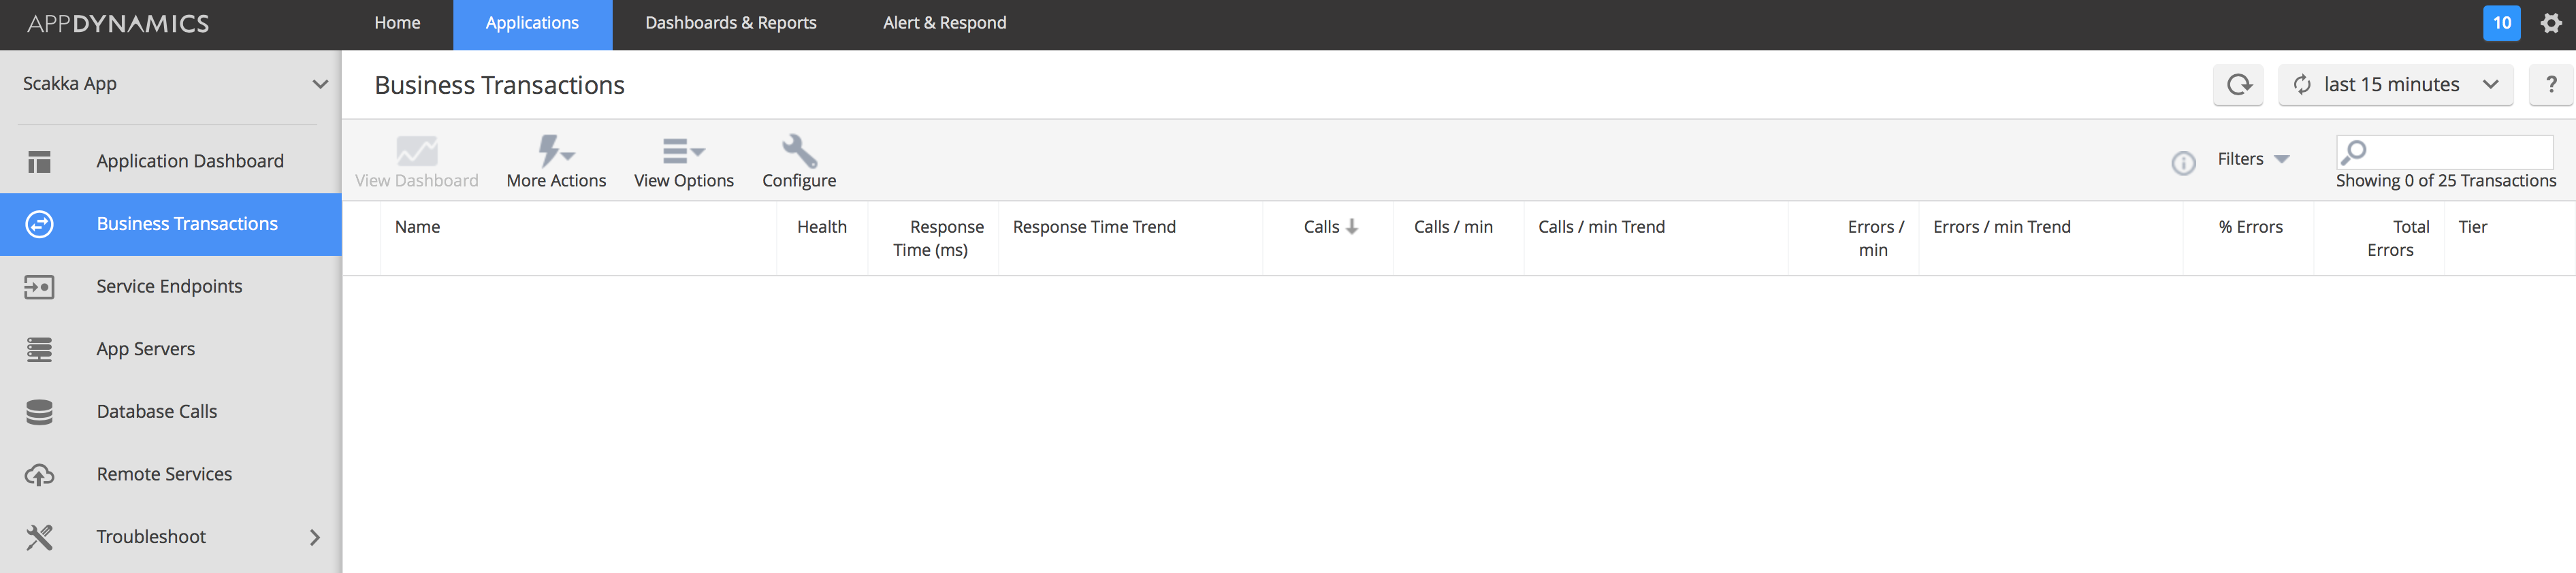
Sometimes you’re lucky, and AppDynamics will just detect everything going on in your app straight away… This wasn’t one of those times. No metrics appeared for any Business Transactions, and the App overview looked very bare. Digging into the App Servers list however showed that my app had indeed been registered, and when I clicked on the Memory tab I could see that memory usage was being monitored.
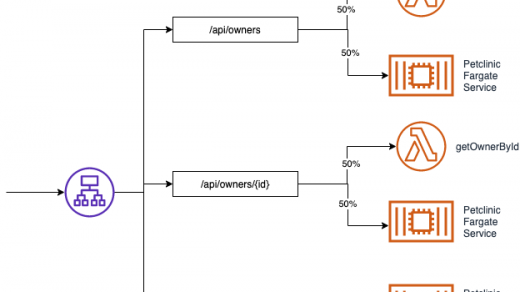
Ok, so I’m guessing AppDynamics wasn’t able to detect any entrypoints, as the app establishes it’s own outward connections, so nothing from the outside initiates connections to it. I also couldn’t use any of the automated instrumentation that the Spring framework benefits from either.
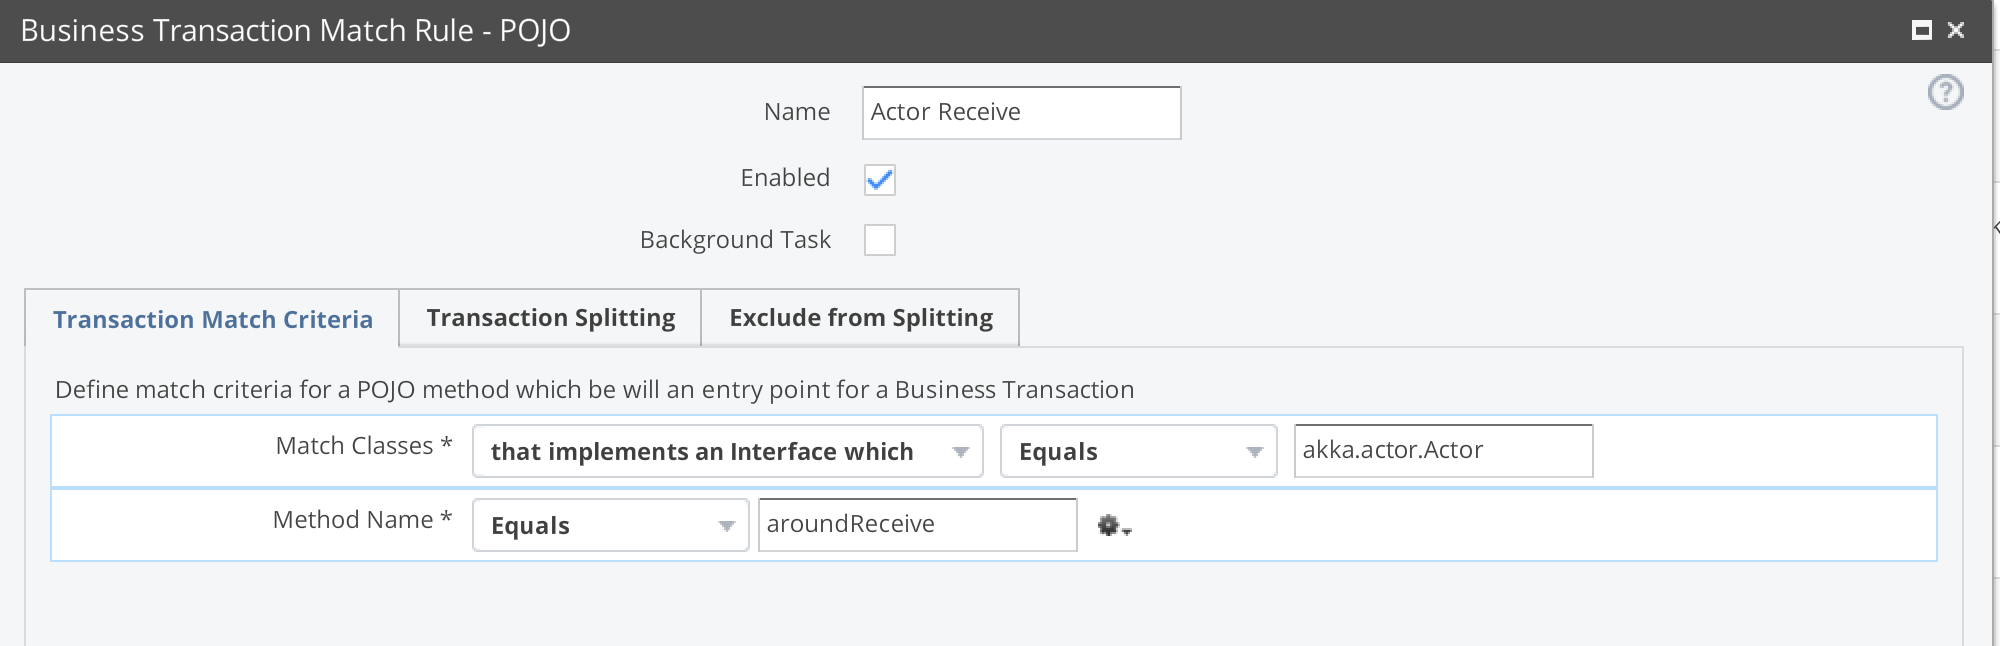
I got around this by adding some custom POJO instrumentation, by monitoring any objects that implemented the Actor class, and listening for invocations for the aroundReceive method. Splitting the transactions by the simple class name gives a breakdown per Actor type. If necessary you could go a level further and split by message type, but I felt this was a bit OTT to start with.
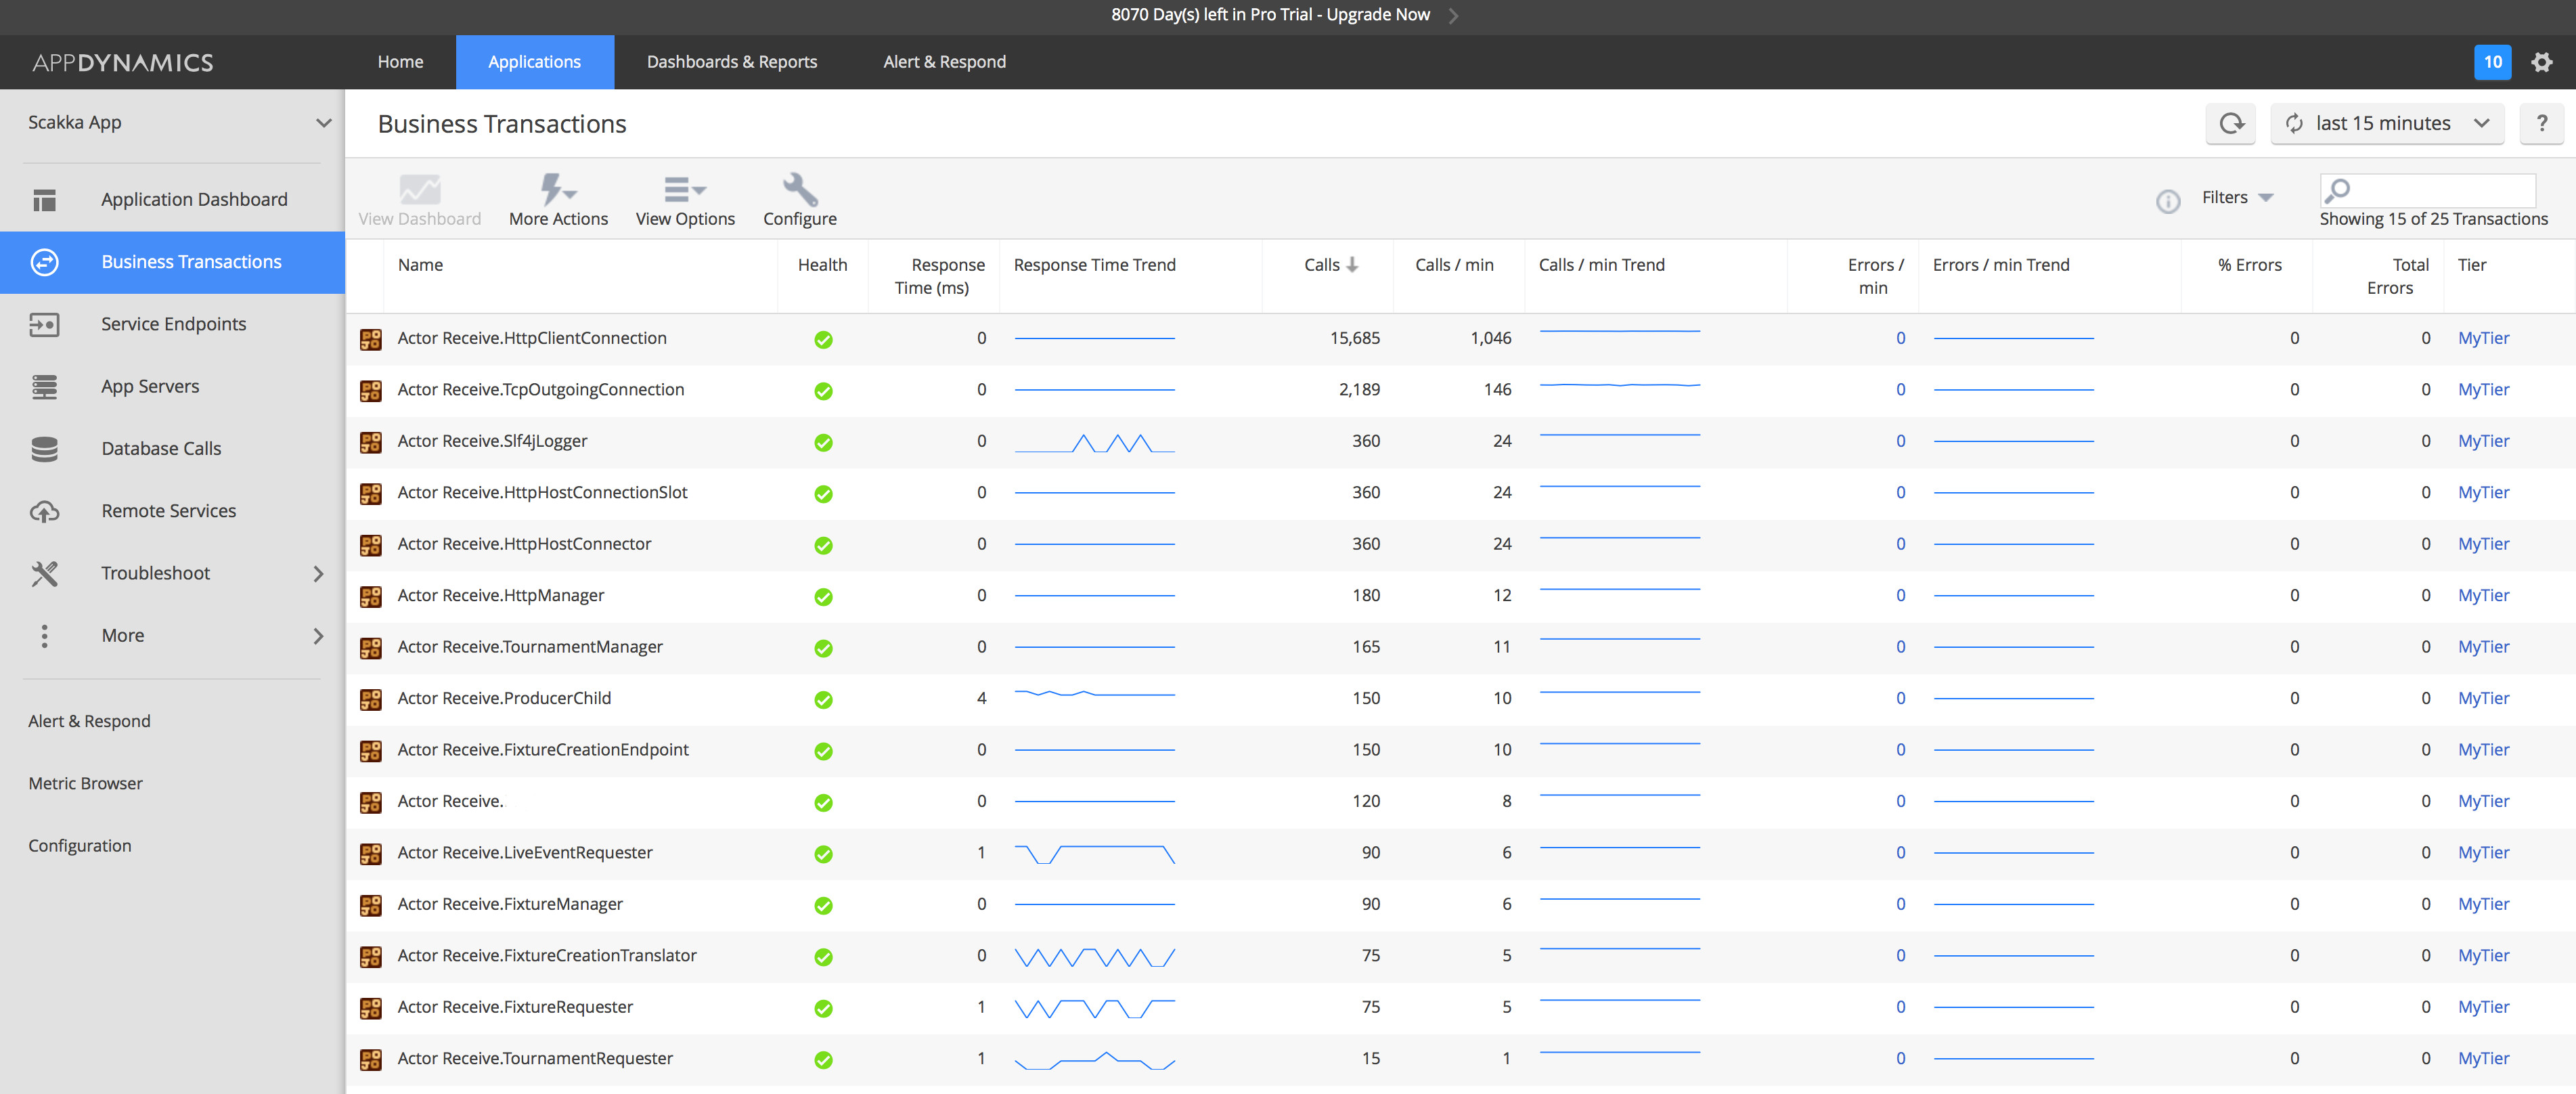
From here, you get high level metrics about each Actor, such as response times, calls per minute, error rates, each accompanied by historical sparklines. Double Clicking each of the Business Transactions provides very detailed information, from a graphical view of interactions (i.e. http calls made) right down to elapsed time at method level.
AppDynamics’ ability to track errors logged using SLF4J pretty much gives me everything I’d like from a app monitoring perspective, however there are a couple of drawbacks. Firstly there is a free version, but it limits you to storing 24 hours of data, and you can only track 1 JVM instance with it. This makes it very limited if you wanted to monitor interactions acreoss a number of co-ordinated microservices. AD’s default refresh rate of metrics appears to be a minute, although this may be configurable. This might not be realtime enough for some people but hasn’t been a problem for me.
Secondly I tried using the Kamon stack to see what compareable metrics I could get from my app. The benefits from this stack are that as it’s free (as it’s open source) and as it’s modular you can mix and match many of the components within it. For example, you could use a different metrics aggregator (instead of StatsD) or a different dashboaring tool (instead of Graphana), or you can embed it within your own app monitoring framework. As it’s open source it shouldn’t be too difficult to write your own extensions to give you extra functionality.
I used the following example stack (https://github.com/muuki88/docker-grafana-graphite) that all runs within a single Docker app and makes starting up and tearing down a breeze. From what I’ve seen this appears to be the standard platform for monitoring Akka so far.
Setting it up was a bit more involved compared to AppDynamics, which put me off a little as I’d like a monitoring platform to be as unobtrusive as possible. Compared to AD, I had to add a number of Kamon components as dependencies, and also the AspectJ Weaver (as this is how Kamon instruments methods within the Actor system). The AspectJWeaver.jar also needs adding as a Java Agent – there’s 3 ways provided to do this, I used the -javaagent argument option as this allowed me to run it directly from IntelliJ (without having to run sbt externally)
Once I got Kamon working correctly with my app, I configured the monitoring. Again this is more intrusive than AD as it’s done within the app’s config file. However, it provides a number of configuration options, such as filters for including or excluding Actors, Routers and Dispatchers. You can also change the tick interval (to make dashboard updates more frequent) and include System and JVM metrics (such as CPU usage, host memory and jvm heap memory consumption, network utilisation etc.)
Once this was running and posting data to StatsD, I connected to the Graphana app on the webapp port advertised by docker (use “docker ps” to find out what this is) and started playing about with what was available. Firstly I created a row by selecting the button on the left, added a chart, and then started looking through all the metrics that were available. Most of them appear under the stats.timers hierarchy, and are collated under your app name (which is declared within the Kamon configuration in your app’s config file, under the kamon.statsd.simple-metric-key-generator.application element). The Akka-specific metrics live under the akka-actor section, and is constantly updated with your Actors as the system creates new ones.
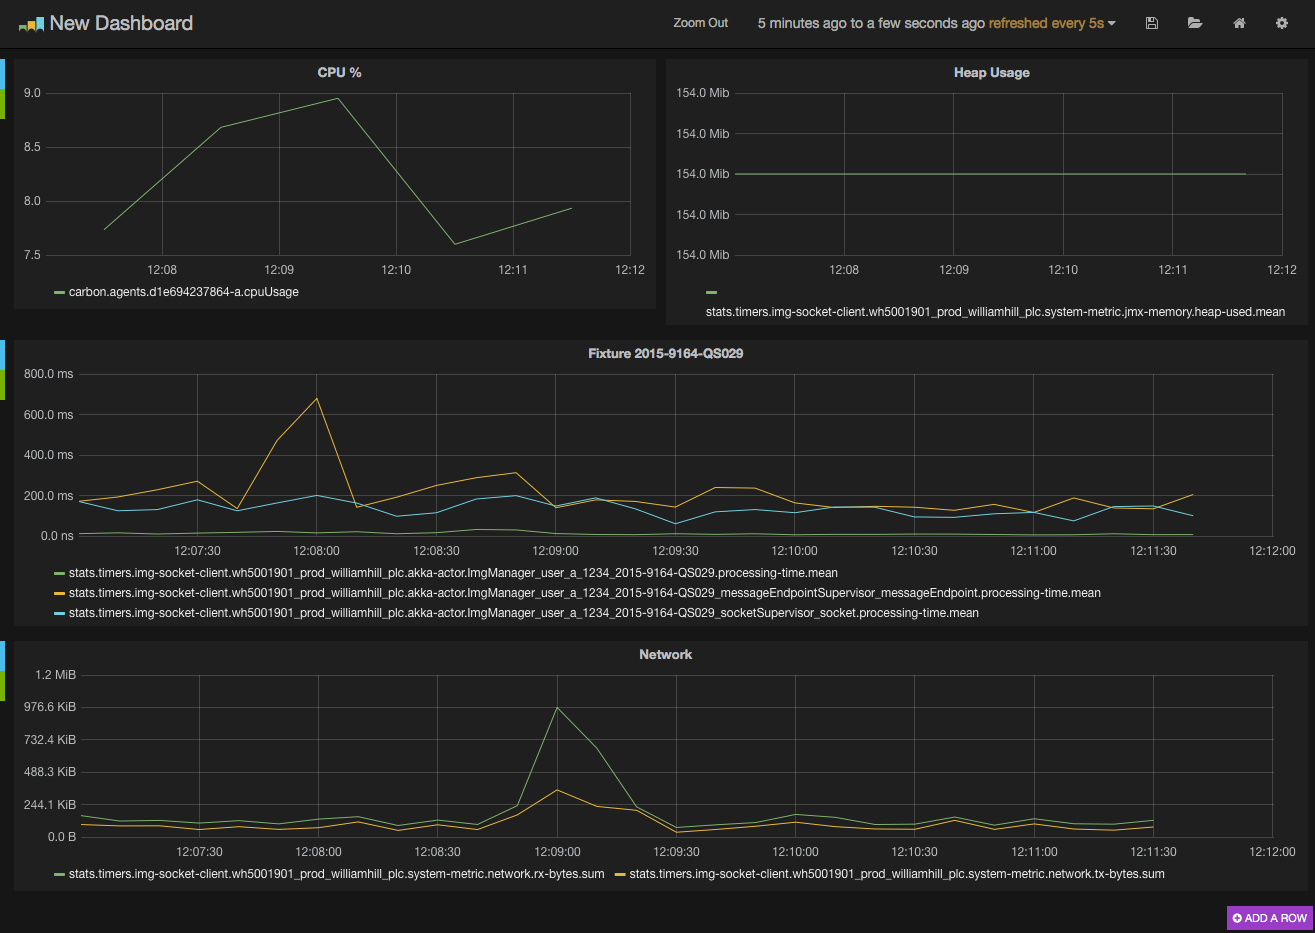
I didn’t like how Graphana didn’t know what scales or format to use for any of the metrics, this had to be done manually. I suspect this is because there’s no metadata about the metrics available, which is understandable given it’s a pretty generic framework for aggregating whatever metrics you want. For example, When adding the processing time, it doesn’t provide any suggestions, and leaves you to pick between seconds, milliseconds, nanoseconds etc. Given I didn’t know at which level Kamon was recording these made it difficult to pick the right one!
Kamon doesn’t currently provide much in the way of metrics, although I’m sure that’s set to increase with future releases. Alongide the system metrics (i.e. CPU, memory, heap usage etc.) it provides, Kamon specificically monitors Akka so it can give you informtion on processing time, time spent in mailbox etc., which may be more useful than AD as it only provides generic metrics. Along with the few Akka metrics already available, another one I’d like is messages processed, so I can see if an Actor is getting swamped or processing more than it should.
For now, I think I’ll be sticking with AppDynamics – yes it’s more heavyweight (needs a dedicated VM) and not free, it provides more than enough information for me to make informed decisions about an applications performance or issues. When I need to monitor more than one microservice simultaneously however I might need to look elsewhere.
Then again, it’s quite likely that my lack of knowledge with the Kamon stack has limited my understanding of its potential. If anybody has examples or suggestions on how it can be better refined to monitor these kind of applications please comment below, it would be greatly appreciated!